Tuesday, 25 January 2011
Friday, 21 January 2011
This is seventh graph to show the results of my school magazine research questionnaire
When asked how often they would like to see the magazine released, the idea that it would be released weekly received the large majority of the results, 70%. A monthly release received 20% and Daily 10%. Bi-Weekly, Quarterly and Annually all received no responses and therefore all having 0%
This my my sixth graph to show the results of my school magazine research questionnaire
When asked if they would like to contribute towards the magazine none of the responses were 'Yes', with all of the responses being 'No'.
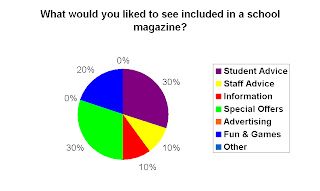
This is my fifth graph to show the results of my school magazine research questionnaire
The results of the questionnaire show that students would most like to see Student Advice and Special Offers included in the magazine both receiving 30% of the responses, with Fun & Games receiving 20% and information and staff advice both received 10% where as nobody wanted to see advertising included, receiving 0% of the responses
Wednesday, 12 January 2011
This is the fourth graph for my questionnaire for school magazine research
Tuesday, 11 January 2011
This is the third graph to show the results of my school magazine researh
This graph shows how much people would be willing to spend on a school magazine. Half of he people said they would be willing to spend between £1.01 and £1.50. Nobody said they would be willing to pay over £2.00 for the magazine.
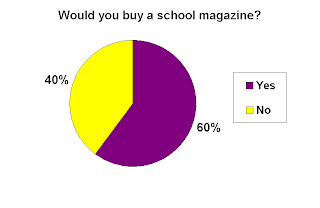
This is the second graph to show the results of my school magazine research questionnaire
This Graph is showing how many people would be willing to buy school magazine, with 60% of people saying yes, where as 40% of people answered no.
Subscribe to:
Posts (Atom)


